

Job Market Results: LinkedIn & US Bureau of Labor (Dec 2024 & Jan 2025)
Check out the latest LinkedIn (Dec 2024) & US Bureau of Labor (Jan 2025) results on Hiring Growth, the Unemployment Rate, Top Metros for Hiring, Average Wage Changes, and who ADDED Jobs!

If you enjoy this article, please consider hitting the 💜 “Like” button here at the top or bottom of this post. It helps others find it! 🙏

Hello sweet friends!
I’m back with the latest overall Labor Market results from two of my leading sources to look at ‘the numbers’:
The LinkedIn Workforce Report for January 2025 (with December 2024 numbers)
The US Bureau of Labor Results for January 2025 (with January 2025 numbers)
We’ll dive into the numbers momentarily. But first up, my thoughts!
My Thoughts Overall
It’s a decent start to the 2025 calendar year, and we’re walking into (typically) some of the busiest months of the year for hiring.
Fresh off the LinkedIn numbers (although I wish they had reported on January 2025’s data instead of up to the end of December 2024), it seems things have stabilized and “boosted” in many ways! The height of the hiring slowdown was a reported 12% (from Jan-Dec 2023), whereas across 2024 (Jan-Dec 2024), it slowed only 3%.
From a hiring perspective, I could “feel” that 2024 was a much better year for hiring. It’s great to “see” the numbers illustrate that, too!
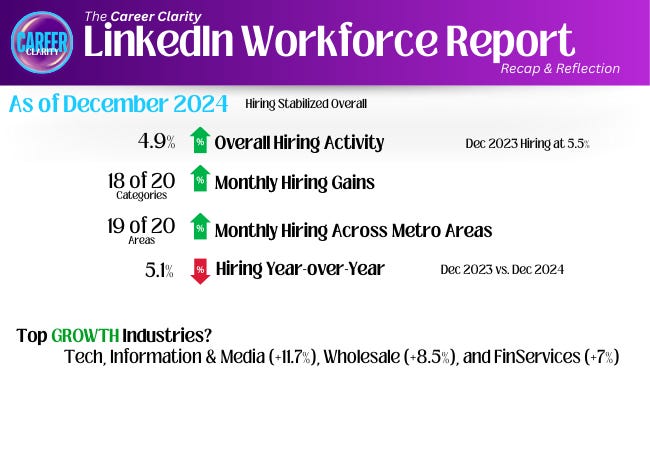
In comparing December’s acceleration of hiring, in 2023, it was at 5.5%, whereas in 2024, it was just behind it at 4.9%. So again, it looks like it was comparable (and in the green!) despite it being just a smidge lower.
There were broad industry gains in December 2024 (LinkedIn reported 18 out of 20 industries had increased) as well as hiring gains across nearly all major metros (LinkedIn reported 19 out of 20 metros they track gained!).
The largest industry gains were Technology, Information and Media (+11.7%), Wholesale (+8.5%), and Financial Services (+7%). These may be great to target if you’re searching for jobs!
The largest metro gains were Denver (+9.3%), Atlanta (+8.1%) and Washington D.C. (+7%). If you’re looking for a new spot to relocate or consider jobs in, these may be great to start with!
The Unemployment Rate (thank you, USBOL, for reporting) fell slightly in January 2025 to 4.0% (from 4.1% in December 2024).
Looking ahead to the recent change in leadership in the White House, I am curious to see how some of those executive orders will impact the overall market (given the gravity I’ve seen already). Things like additional tariffs and the “ending” of remote work for government employees impact the job market in many ways.
I’m keeping my eye on it and look forward to reporting on the impact of January numbers (from LinkedIn specifically) next month!
💜 Lavender
LinkedIn Workforce Report
Overall, the most promising result was seeing the “stabilizing” of the previous hiring slowdown momentum and the growth in the other report indicators.
LinkedIn Hiring Rate in the United States

USBLS Results
Overall, it looks like most numbers have “changed little” across (almost) every category indicator I like to track.
The USBLS Employment Situation Numbers
Unchanged (or “Changed Little”)
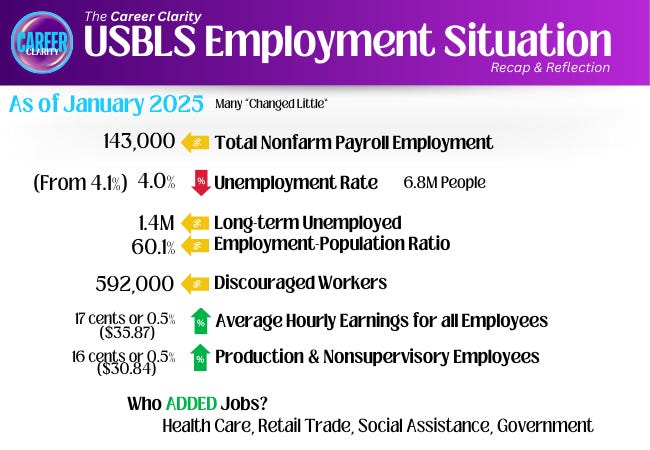
Total Nonfarm Payroll Employment at 143,000 jobs
2024 Average Monthly Gain: 166,000 jobs
Long-term Unemployed at 1.4 million
Employment-Population Ratio at 60.1%
Decreased
Unemployment Rate went down to 4.0% (covered in the section below) at 6.8 million people
Increased
Average Hourly Earnings (Private Nonfarm) for All Employees went up 17 cents or 0.5% (to $35.87)
Past 12 Months: average hourly earnings increased by 4.1%
Production & Nonsupervisory (Private Sector) Employees went up 16 cents or 0.5% (to $30.84)
The reason I selected these specific indicators is because they have fared well in tracking the overall employment picture. Because I have spent most of my career time on the “hiring” side of the table, these indicators (to me) seem to be the best indicators of overall change. They also serve well when gauging the “real feel” according to candidates and the hiring or job market.
Unemployment Rate
Although it may be a smaller shift, the Unemployment Rate has decreased from 4.1% to now a flat 4.0%.
Seeing the slight shift downward is a positive. But with the rest of the numbers (mostly) remaining the same, this means not a ton has changed with our zoomed-in month snapshot.

Want more information?
If you’d like to check out the data I included here, please visit:
The LinkedIn Workforce Website here: https://economicgraph.linkedin.com/workforce-data?
The USBOL Website here: https://www.bls.gov/
If you enjoy this article, please consider hitting the 💜 “Like” button here at the bottom or top of this post. It helps others find it! 🙏